
How to Analyze Your ELISA Data
Jul 29, 2022Analyzing your data is just as important as performing your ELISA experiment! For best results, we recommend using curve-fitting software like Curve Expert 1.4 to analyze the results of your ELISA kit experiment.
This demonstration using Curve Expert 1.4 will show how to construct your ELISA standard curve, and how to use the curve equation to calculate your experimental results.
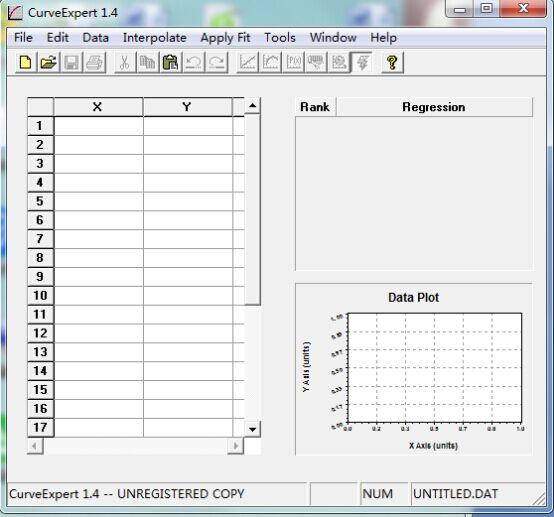
1. Open Curve Expert 1.4, and you should see the following screen.
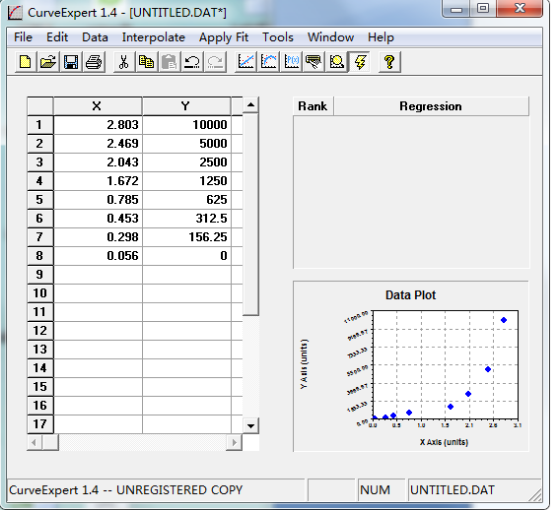
2. Using the data from your standard curve, input the OD value on the X-axis, against the sample concentration on the Y-axis.
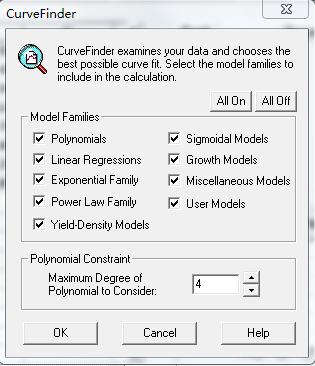
3. Click this icon to open model options.
4. Click the ‘All Off’ button.
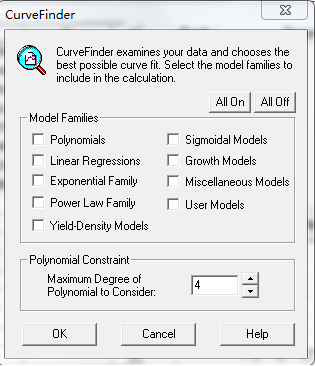
5. Select Sigmoidal Models to fit to your ELISA standard curve.
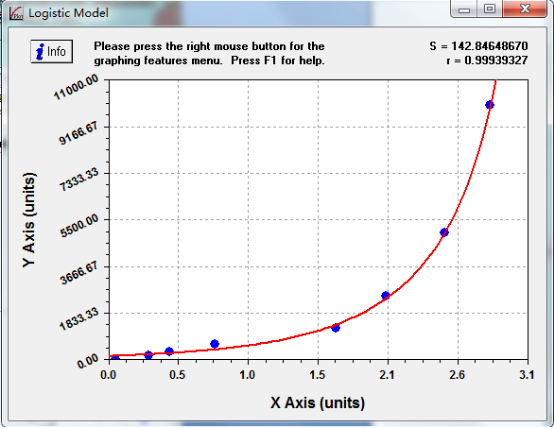
**Please note that the higher the r-value for your equation (or the closer the r-value is to 1), the more reliable values you will get.
6. Hit Ctrl + L in the blank part of the above picture to open the analysis interface.
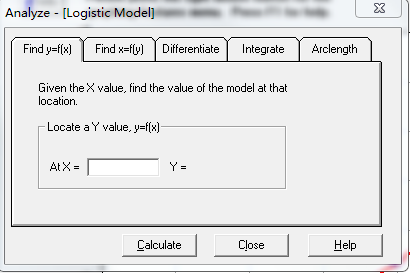
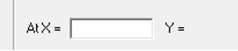
After inputting the corresponding OD value (x-value), hit “Calculate” to obtain the concentration (Y-value) of the sample. Factor in any dilutions if necessary.
7. Click the button on the top left corner to obtain the ELISA curve fitting equation.
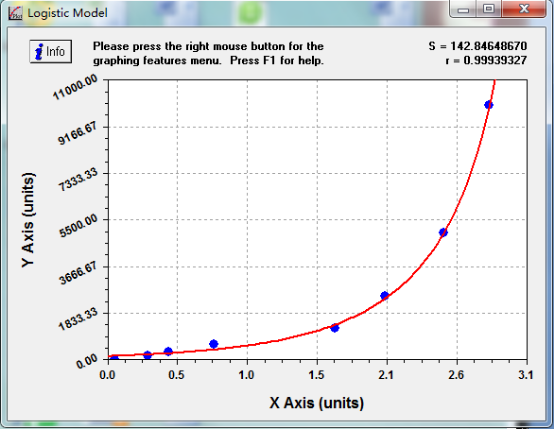
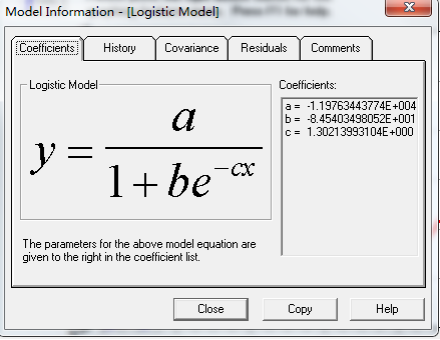
8. Logistic Model: y=a/(1+b*exp(-cx))
Coefficient Data:
a = -1.19763443774E+004
b = -8.45403498052E+001
c = 1.30213993104E+000
Click the button “copy” and you will get the figures for curve equation showed in the above screen shot.
Logistic Model: y=a/(1+b*exp(-cx))
Coefficient Data:
a = -1.19763443774E+004
b = -8.45403498052E+001
c = 1.30213993104E+000
If you have any questions, or require assistance analyzing your data, please Contact Us for more information.